XRP’s Tightening Consolidation Puts $2 Breakout in Focus


XRP is consolidating after a sharp recovery from the $1.00 area, with price now holding well above the major support zones visible on the daily chart. The broader structure has improved, although the 4-hour chart shows that XRP is still trading beneath a descending trendline and remains capped by the $1.60-$1.70 resistance region.

XRP Price Analysis: The USDT Pair

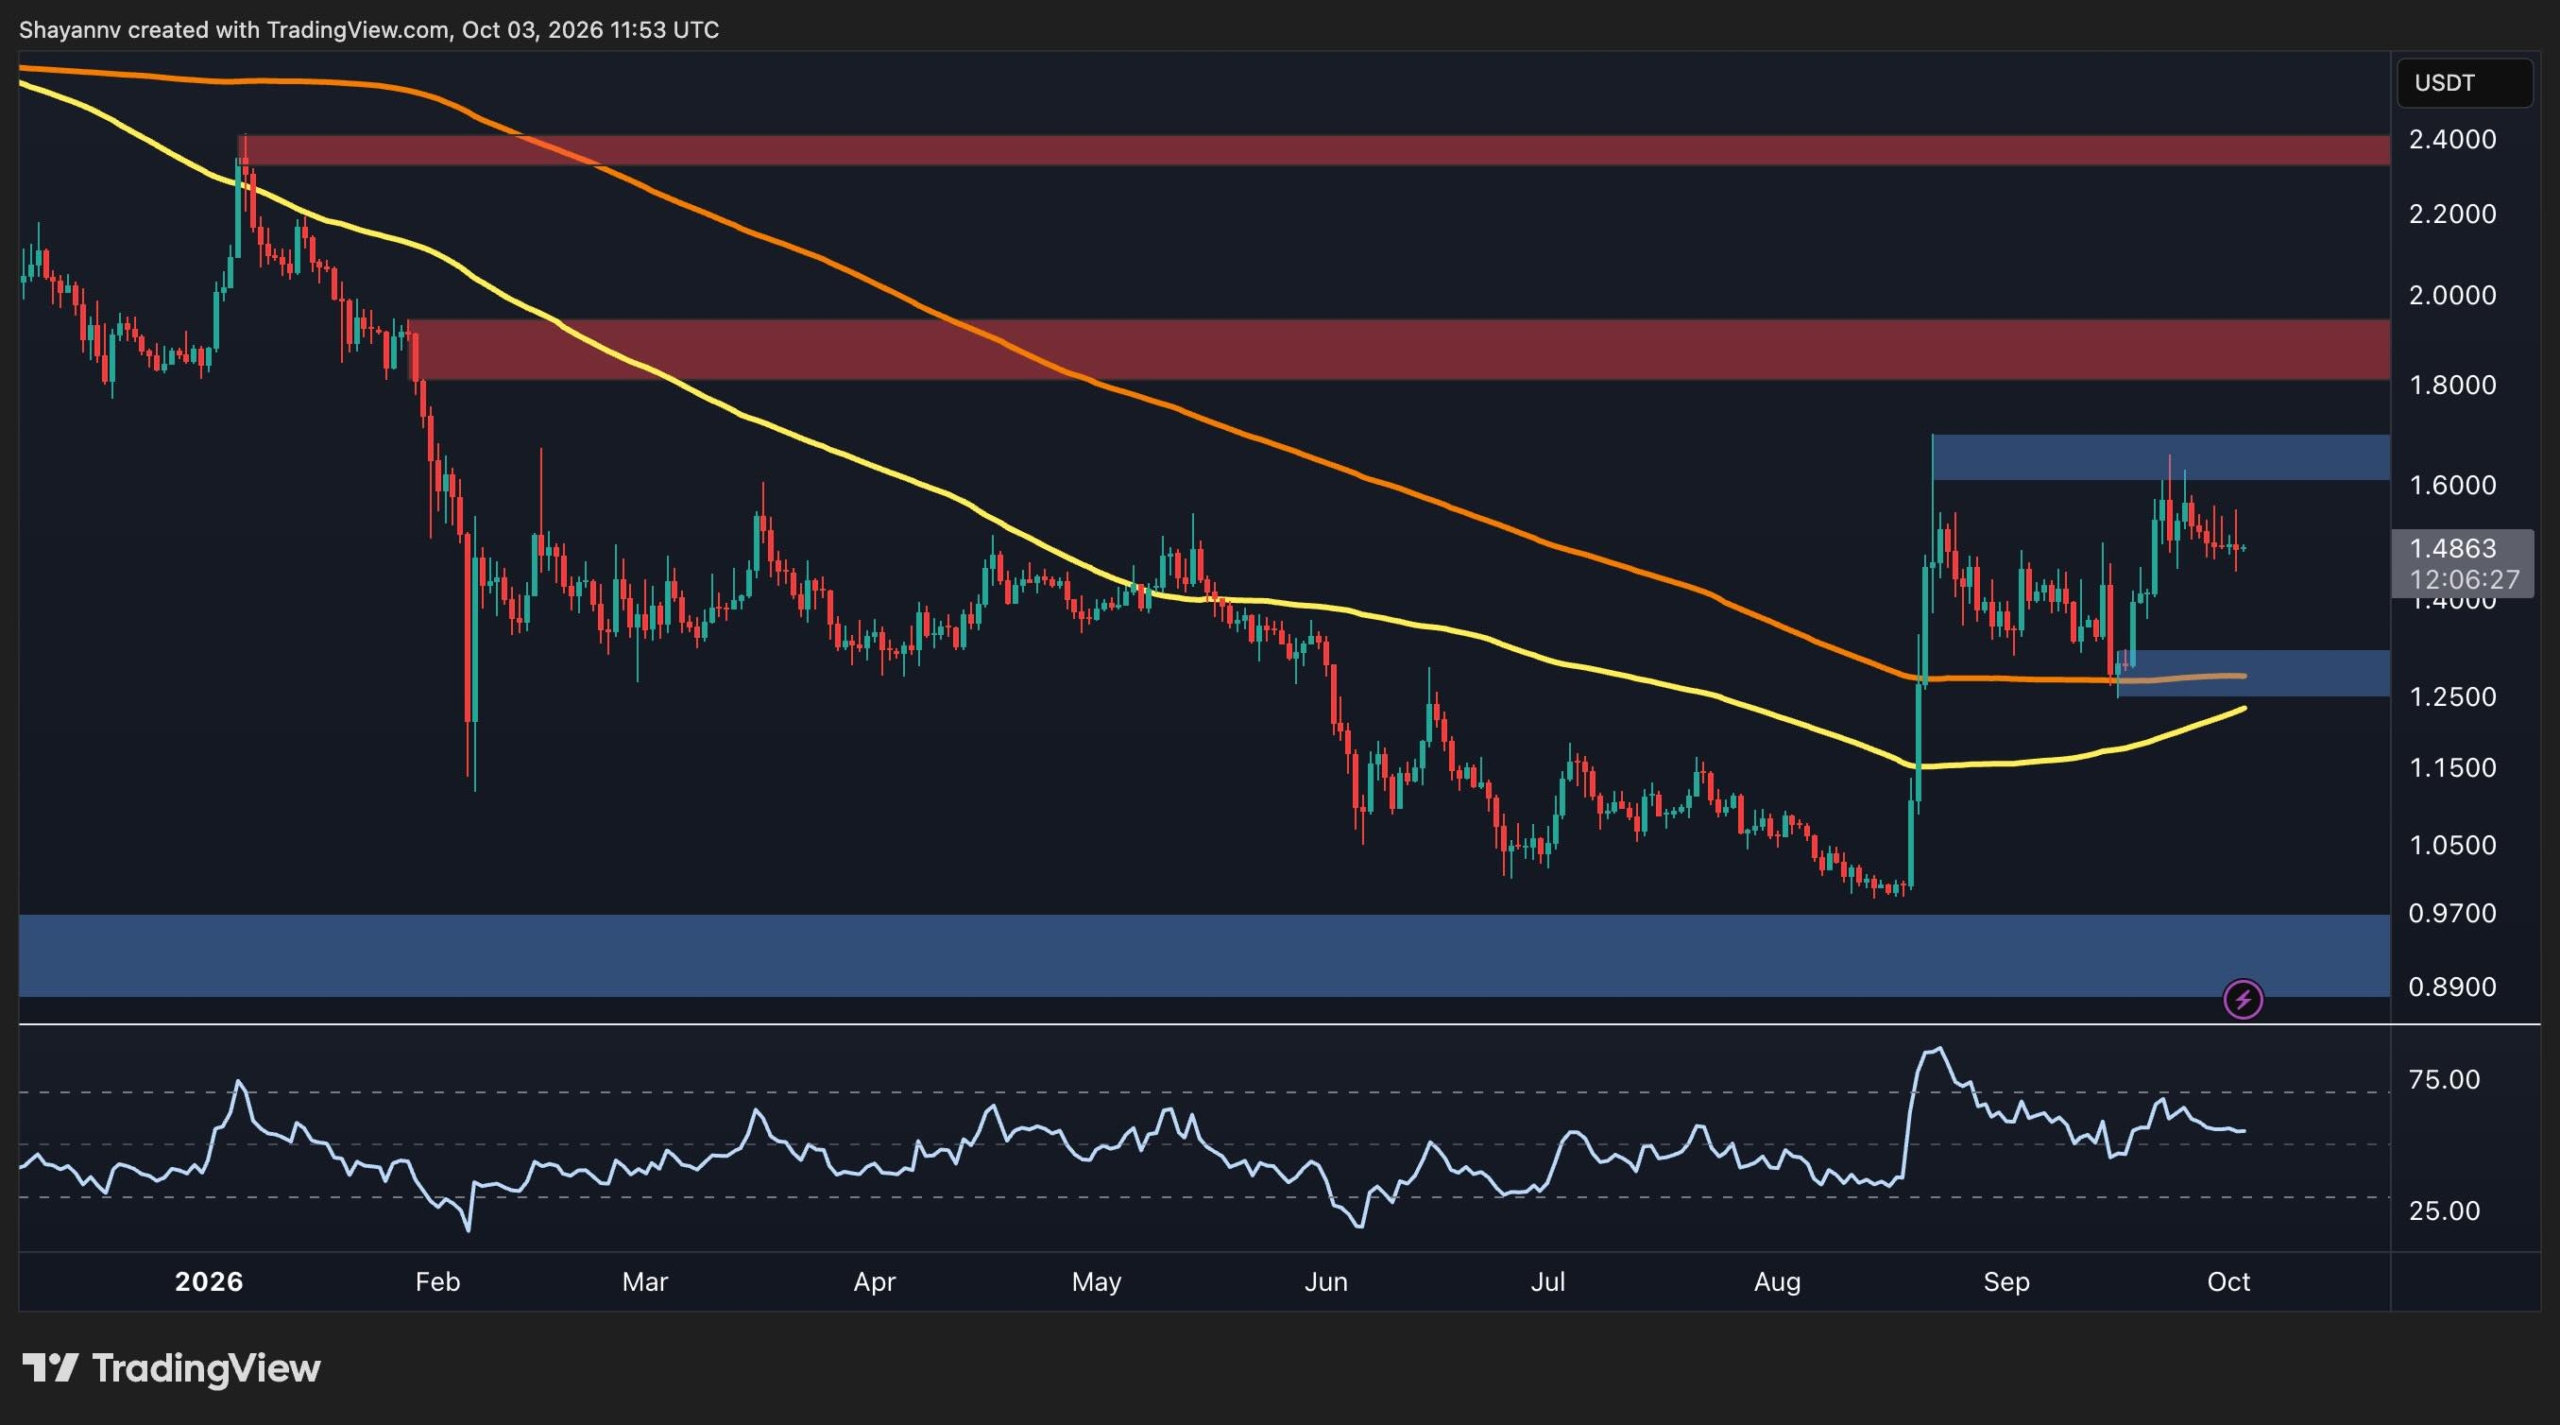
On the daily timeframe, XRP has established a significant rebound from the $1.00 support zone. The subsequent rally pushed the price back above the 100-day and 200-day moving averages, which have started to flatten and turn higher around $1.30. This represents a notable structural improvement compared with the prolonged downtrend seen through the first half of the year.

XRP is currently trading around $1.49, with the nearest support located around $1.30. This zone is particularly important because it aligns with the recent breakout area and the daily moving averages. As long as XRP remains above this region, the broader recovery structure remains intact.

On the upside, the main resistance is the $1.60-$1.70 zone, which has already capped the recent advance. A sustained move through this area would put the next major resistance around $1.80-$2.00, followed by the more critical $2.40 supply zone visible on the chart.

The daily RSI has also cooled considerably from its recent overbought reading and is now around the middle of its range. This suggests that momentum has normalized rather than showing an obvious overbought condition. A renewed move higher while RSI expands could therefore provide additional confirmation of bullish momentum.
The 4-Hour Chart

The 4-hour chart shows a more cautious picture. XRP rallied toward the $1.60-$1.70 resistance level in late September but subsequently formed a series of lower highs beneath a descending trendline. The asset is currently around $1.49, leaving the trendline as an important short-term obstacle.

The immediate support sits around $1.45, marked by the green horizontal zone. XRP has repeatedly consolidated around this area, making it an important level for the short-term structure. A decisive loss of this support could expose the broader $1.20-$1.30 demand zone.

On the other hand, a breakout above the descending trendline would likely break the current corrective structure. XRP would then need to reclaim the $1.60-$1.70 resistance zone to establish a clearer continuation of the recent recovery.

Overall, the charts show a recovery structure that remains constructive above $1.20-$1.30, but XRP still needs to overcome $1.60-$1.70 to confirm a stronger bullish continuation. A break below $1.45 would instead increase the risk of another move toward the lower support zone.


Disclaimer: Information found on CryptoPotato is those of writers quoted. It does not represent the opinions of CryptoPotato on whether to buy, sell, or hold any investments. You are advised to conduct your own research before making any investment decisions. Use provided information at your own risk. See Disclaimer for more information.


Source link


XRP is consolidating after a sharp recovery from the $1.00 area, with price now holding well above the major support zones visible on the daily chart. The broader structure has improved, although the 4-hour chart shows that XRP is still trading beneath a descending trendline and remains capped by the $1.60-$1.70 resistance region.

XRP Price Analysis: The USDT Pair

On the daily timeframe, XRP has established a significant rebound from the $1.00 support zone. The subsequent rally pushed the price back above the 100-day and 200-day moving averages, which have started to flatten and turn higher around $1.30. This represents a notable structural improvement compared with the prolonged downtrend seen through the first half of the year.

XRP is currently trading around $1.49, with the nearest support located around $1.30. This zone is particularly important because it aligns with the recent breakout area and the daily moving averages. As long as XRP remains above this region, the broader recovery structure remains intact.

On the upside, the main resistance is the $1.60-$1.70 zone, which has already capped the recent advance. A sustained move through this area would put the next major resistance around $1.80-$2.00, followed by the more critical $2.40 supply zone visible on the chart.

The daily RSI has also cooled considerably from its recent overbought reading and is now around the middle of its range. This suggests that momentum has normalized rather than showing an obvious overbought condition. A renewed move higher while RSI expands could therefore provide additional confirmation of bullish momentum.

The 4-Hour Chart

The 4-hour chart shows a more cautious picture. XRP rallied toward the $1.60-$1.70 resistance level in late September but subsequently formed a series of lower highs beneath a descending trendline. The asset is currently around $1.49, leaving the trendline as an important short-term obstacle.

The immediate support sits around $1.45, marked by the green horizontal zone. XRP has repeatedly consolidated around this area, making it an important level for the short-term structure. A decisive loss of this support could expose the broader $1.20-$1.30 demand zone.

On the other hand, a breakout above the descending trendline would likely break the current corrective structure. XRP would then need to reclaim the $1.60-$1.70 resistance zone to establish a clearer continuation of the recent recovery.

Overall, the charts show a recovery structure that remains constructive above $1.20-$1.30, but XRP still needs to overcome $1.60-$1.70 to confirm a stronger bullish continuation. A break below $1.45 would instead increase the risk of another move toward the lower support zone.


Disclaimer: Information found on CryptoPotato is those of writers quoted. It does not represent the opinions of CryptoPotato on whether to buy, sell, or hold any investments. You are advised to conduct your own research before making any investment decisions. Use provided information at your own risk. See Disclaimer for more information.


Source link

More from author

LEAVE A REPLY

Please enter your comment!
Please enter your name here

Related posts

Latest posts

October Prime Day 2026 is here: Live updates on Apple, Yeti, and Kindle deals

Amazon is hosting its annual Prime Big Deal Days sale on...

Spain’s Housing Pressure Puts Sánchez’s Election Strategy to the Test

Spanish election Polymarket odds are live after Pedro Sánchez called Spain’s next general election early, in a snap contest for November 29, and...

Everybody’s Favorite Art TV Is Nearly Half Off for Prime Day (2026)

Samsung's The Frame TV is at its lowest price ever right now, at 40 percent off—a very appealing deal for one of the...

Want to stay up to date with the latest news?

We would love to hear from you! Please fill in your details and we will stay in touch. It's that simple!